


12 January 2025, 22:20
.png)
A table showing the number of inspection visits by the Institutions Inspection Directorate for the year 2023
 5
5
 5
5
 1
1
 0
0
12 January 2025, 21:39
A table showing the Jordanian labor force by age group for the year 2022
6
9
1
0
12 January 2025, 22:20
Table showing the number of cases related to human trafficking in 2023
4
6
1
0
12 January 2025, 22:20
Table showing the number of inspection visits to domestic workers for the year 2023
3
5
1
0
12 January 2025, 22:19
Table showing the number of domestic workers by nationality and gender for the year 2023
4
6
1
0
12 January 2025, 22:20
Table showing the unemployment rate for Jordanians by gender in 2023
5
7
1
0
12 January 2025, 22:20
A table showing the percentage distribution of unemployed Jordanians by governorate in 2023
8
13
1
0
12 January 2025, 22:22
Table showing the number of specialized skills permits by governorate for the year 2023
6
10
1
0
12 January 2025, 21:39
A table showing the relative distribution of the unemployed Jordanians by educational level (%) for the year 2022
4
5
1
0
12 January 2025, 22:20
Table showing the number of child labor cases in 2023
5
5
1
0
12 January 2025, 22:27
A table showing the number of non Jordanian currencies by nationality and gender for the year 2022
4
3
1
0
12 January 2025, 21:39
A table showing the relative distribution of the unemployed Jordanians by gender
5
3
1
0
12 January 2025, 21:42
A table showing the economic participation rate of Jordanians by governorate for the year 2022
4
8
1
0
12 January 2025, 21:42
A table showing the relative distribution of employed Jordanians by governorate for the year 2022
2
7
1
0
12 January 2025, 21:39
A table showing the Jordanian labor force, the number of the employed, and the number of the unemployed by gender
3
6
1
0
12 January 2025, 22:22
A table showing the percentage distribution of unemployed Jordanians by age group for the year 2023
3
6
1
0
12 January 2025, 22:01
A table showing the Jordanian labor market indicators for the year 2021
2
3
1
0
12 January 2025, 21:42
A table showing the relative distribution of employed Jordanians by gender
3
3
1
0
12 January 2025, 21:39
A table showing the relative distribution of the unemployed Jordanians by governorate
4
7
1
0
12 January 2025, 22:01
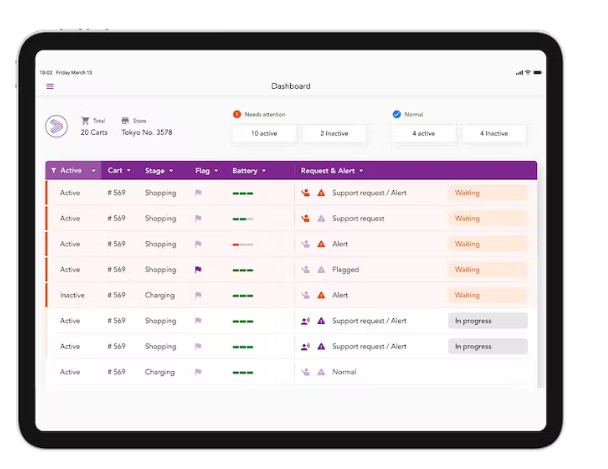
Labor market indicators
5
7
1
0


 Light Contrast
 Invert Contrast
 Dark Contrast
 Low Saturation
 Highlight Links
 Adjust Text Spacing
 Font Size
 Font Type
 Reading
 Line Height
 Text Alignment
 Align Left
 Align Center
 Justify